Barfoot & Thompson’s latest list of Auckland’s top 20 growth suburbs shows the median price in Auckland Central – which is made up almost entirely of apartments – increased by 106.6% over the last 18 months.
The agency compiled the list by comparing median sale prices for the six months between August 2015 and January 2016 with the same period the previous year.
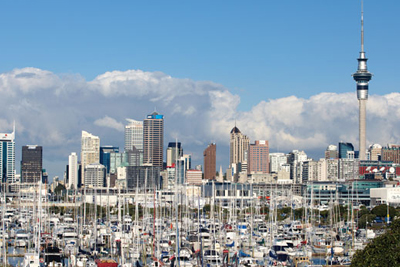
Auckland Central’s six month median price is $544,000, which is lower than in many other Auckland suburbs.
But it is a dramatic increase from the previous period’s median price of $263,250.
Barfoot & Thompson managing director Peter Thompson said the apartment market has grown considerably.
“Both completed apartments and those available for purchase off the plans are gaining lots of interest from first home buyers, investors and luxury down-sizers alike.”
Some of the high-end apartment developments currently under construction, like those at Wynyard Quarter, have added to the suburb’s sales figures during the recent period, he said.
“With all this new development has come a new generation of apartments, with a greater focus on design and lifestyle and, in turn, a higher price point.”
This data goes against Trade Me Property’s data, released just last week, which indicated that growth in the apartment market, particularly in Auckland, had started to wane.
But Apartment Specialists’ director Andrew Murray said he didn’t agree with Trade Me Property’s take on the Auckland apartment market.
“The market was a bit flatter at the end of last year, so maybe their view is based on data from that period. But, overall, there has been a dramatic increase in apartment prices.”
Further, sales activity in January and February was booming, he said.
“Ongoing high migration, combined with the fact that there is still not enough stock being built to satisfy demand, means the apartment market is going to get really interesting.”
Auckland Central’s top spot in the Barfoot & Thompson data appears to support this view.
Thompson said the list was reflective of an ever-changing market, with 12 suburbs of the suburbs entirely new to the top 20.
Many of the suburbs that ranked highly in the agency’s first list in September 2015 have now dropped out of the top 20.
Those areas are likely to still be enjoying some value growth, but their decline suggests that their growth may have peaked for now, Thompson said.
“The list builds an interesting view of the cycles suburbs can go through and the speed at which price can change.”
In the last list, North Shore suburbs were a dominant force. But, this time round, it is West Auckland suburbs which lead the way.
Coming in at number two and three on the top 20 list were Sandringham and New Lynn, with growth of 69.4% and 47.2% respectively.
Thompson said both of these suburbs are well-known growth areas.
“Sandringham offers city fringe living, with many villas and a village feel, while continued investment in New Lynn transport links, housing options, shopping and entertainment has put it firmly on the map.”
Barfoot & Thompson’s top 20 Auckland growth suburbs were:
1. Auckland Central (106.6%)
2. Sandringham (69.4%)
3. New Lynn (47.2%)
4. West Harbour (39.3%)
5. Epsom (38.4%)
6. Manurewa (35.2%)
7. Murrays Bay (34.9%)
8. Panmure (34.3%)
9. Kelston (33.7%)
10. Papakura (33.3%)
11. Mairangi Bay (33.0%)
12. Waiuku (32.9%)
13. Massey (31.8%)
14. Forrest Hill (30.2%)
15. Mt Albert (29.9%)
16. Royal Heights (27.5%)
17. Dannemora (26.8%)
18. Glen Eden (26.1%)
19. New Windsor (25.8%)
20. Papatoetoe (25.6%)

 Search