Trade Me’s August Property Price Index shows houses are selling within 68 days – falling six days from July. In comparison, properties were selling in just 28 days in 2021 at the height of the booming market.
Selling hit rock bottom in July this year when properties were spending 74 days on Trade Me’s website, while the national average asking price reached its lowest point since June 2021.
Trade Me property sales director Gavin Lloyd says last month was the turning point. “Days onsite wasn’t the only sign that the market had bounced back with vendors moving towards less price transparent methods of sale, he says.
“Often the sales method changes depending on market conditions. In a hot market, when demand is high and supply is low, vendors tend to move towards less price transparent selling methods like auctions and tenders. In a cool market, vendors are more transparent about the price they want and opt for methods like enquiries over or an asking price.”
Lloyd says last month there was a small but noticeable shift towards less price transparent methods of sale with auctions making up 19% of total listings, up from 10% in July. The total number of properties listed with an asking price fell from 35% in July to 26% in August.
Property prices increase
The national average asking price increased when compared with July, climbing 0.4 per cent to $837,400.
“While this increase is small, this is yet another indicator the property market reached a turning point in last month, as there haven’t been price increases month-on-month since October,” Lloyd says.
His advice to buyers who have a deposit behind them to talk to a local agent and the bank, and get ready to make a move.
Regions a mixed bag
Following the national trend, the average asking price in several regions increased when compared with July, including Canterbury, up 1 per cent month-on-month; Hawke’s Bay, up 3 per cent; Marlborough, up 3 per cent; Otago, up 5 per cent; Taranaki, up 0.2 per cent; Waikato, up 1 per cent; and West Coast, up 6 per cent.
Meanwhile the largest regions, Auckland and Wellington are yet to follow the national trend with prices continuing to cool.
The average asking price in the Auckland region fell 1.1 per cent on July to $1,023,000 - the lowest since February 2021. In Wellington, prices dipped under the $800,000 mark for the first time since February 2021 to $795,950, falling 1.8 per cent on July.
Vendors and buyers pick up
When compared with July, more properties are listed for sale and more Kiwi are browsing property listings, Lloyd says.
The number of properties for sale increased 2 per cent on July, giving prospective buyers more choice. Buyers were also looking to make the most of the market conditions with a 1 per cent uplift in demand for properties.
“Traditionally between July and August the market continues to cool as buyers and sellers retreat over the winter months. This didn’t happen in August which is surprising, and perhaps a sign of things to come for the market.”
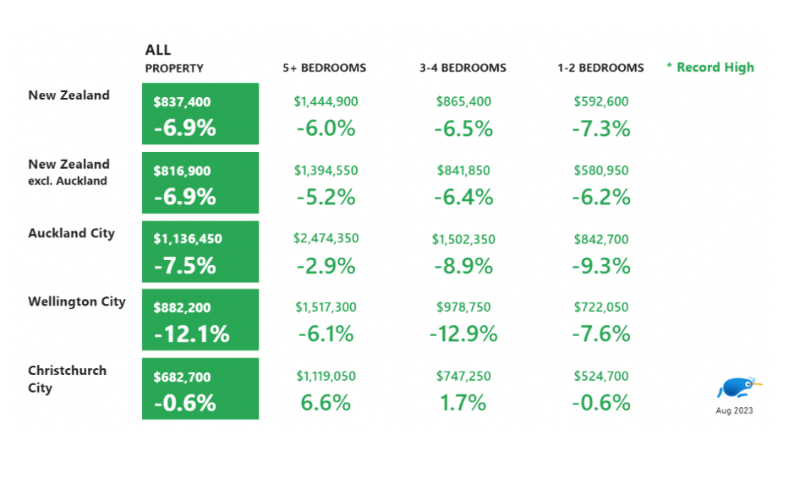
Biggest price drop
Looking at properties by size, small properties of 1-2 bedrooms had the biggest decline nationally when compared with August last year.
In Wellington city, medium sized properties of 3-4 bedrooms had the lbiggest price fall of 13 per cent to just under the million-dollar mark at $978,750.
Large properties of 5+ bedrooms in Christchurch city bucked the national trend with a 7 per cent price jump. However, despite this price bump the average asking price was still $400,000 cheaper than its Wellington city counterparts and $1,300,000 cheaper than the same size property in Auckland city.

 Search