Property

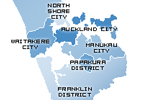
Within Auckland Franklin is flourishing, Waitakeres woeful

The median sales price for a property in the Auckland suburb of Franklin has risen 21% in the year to August 2011, while prices have fallen 35% in the Waitakeres.

Tuesday, September 20th 2011

The figures were revealed in the latest Crockers Auckland sales price table, which also revealed the number of sales in each suburb.

While the Auckland average sales price rose 2% from August 2010, up from $445,000 to $453,000, and the national average rose 1%, up from $350,000 to $355,000, within the Auckland suburbs there were a  wide range of price fluctuations.

Franklin saw the biggest year-on-year rise and also saw a 90% increase in sales, from 40 properties in August 2010 to 76 in August 2011.

Other suburbs that saw significant increases in the median sales price included the Islands of the Gulf (up 18%), Papatoetoe (14%) and Mt Albert (11%).

While the largest fall in price was recorded in the Waitakeres, the figure was based on a low amount of sales – four in August 2010 and just one in August 2011.

Other suburbs to see significant falls in the median sales price included Upper Harbour (-17%), Onehunga/Penrose (-16%) and the Eastern Suburbs (-12%).

Within Auckland over the year to August 2010 there was a 27% rise in sales, up from 1,487 to 1,894. Nationwide, sales rose 21% from 4,287 to 5,192.

The area to see the largest year-on-year rise in sales was Upper Harbour, up 280% from five to 19 sales. Other areas to see significant rises in sales included Albany (up 92% from 36 to 69) and Papakura (up 90% from 30 to 57).

Only one region other than the Waitakeres saw a year-on-year fall in sales, with the Eastern Suburbs down 8% from 119 to 109.

Most Read

Unity First Home Buyer special 3.99
SBS FirstHome Combo 4.29
Co-operative Bank - First Home Special 4.69
ICBC 4.69
ANZ Special 4.75
Kiwibank Special 4.75
ASB Bank 4.75
SBS Bank Special 4.75
TSB Special 4.75
Westpac Special 4.75
AIA - Go Home Loans 4.75
Wairarapa Building Society 4.59
ASB Bank 4.75
TSB Special 4.75
SBS Bank Special 4.75
ANZ Special 4.75
Westpac Special 4.75
AIA - Go Home Loans 4.75
Kainga Ora 4.75
Kiwibank Special 4.79
Nelson Building Society 4.87
BNZ - Std 4.89
SBS Bank Special 5.39
Westpac Special 5.39
ICBC 5.39
Co-operative Bank - Owner Occ 5.49
Kainga Ora 5.49
AIA - Go Home Loans 5.49
ASB Bank 5.49
TSB Special 5.49
BNZ - Classic 5.59
Kiwibank Special 5.59
BNZ - Std 5.59
SBS Construction lending for FHB 3.74
AIA - Back My Build 4.44
CFML 321 Loans 4.75
Co-operative Bank - Owner Occ 5.70
Co-operative Bank - Standard 5.70
Heartland Bank - Online 5.75
ICBC 6.09
Kiwibank - Offset 6.15
Kiwibank 6.15
ASB Bank 6.29
SBS Bank 6.29

More Stories

Four decades of 6-7% yearly house price growth ending

Friday, March 21st 2025

Four decades of 6-7% yearly house price growth ending

New Zealander’s reliance on property capital gains in the mid-single digits is at an end.

[TMM Podcast] Yelsa serves up “marine reserve” of property buyers

Friday, January 31st 2025

[TMM Podcast] Yelsa serves up “marine reserve” of property buyers

It’s been years in the making and former real estate agent Mike Harvey is now coming to market with his platform matching buyers and sellers, an offering he says will be a gamechanger for the industry.

Leaving last year's stumbling housing market behind

Friday, January 17th 2025

Leaving last year's stumbling housing market behind

As interest rates ease and job losses climb, New Zealand’s housing market faces a mixed year of modest growth, with conflicting forces shaping the outlook for homebuyers and investors.

Don’t bet on house prices rising faster than incomes

Wednesday, January 15th 2025

Don’t bet on house prices rising faster than incomes

Former Reserve Bank Governor and National Party leader Don Brash says there are grounds for believing that house prices may finally have ended the three-decade period when they rose significantly faster than incomes.